
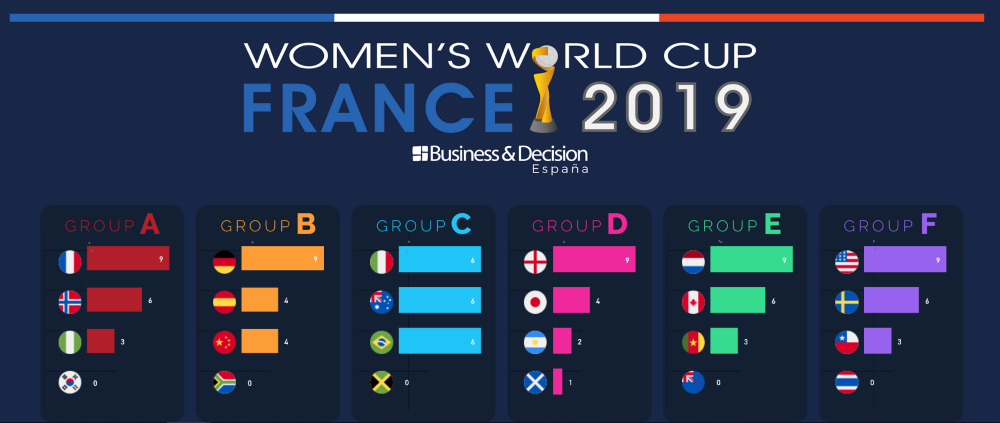
The FIFA women’s world cup started on June 7th and the final is scheduled for July 7th. Which team will win the cup? Will French Soccer have the chance to hang a third star to its prize list? Women practice, still far less publicized than man’s practice, is attracting more and more attention around the world. Our experts realized a Data Visualization on results. Presentation and explanation.

In order to give more visibility to the practice of women’s soccer and sport in general, our Spanish multidisciplinary team, composed by Jesus Sanz, Roberto Ruiz and Amaury de Lausnay, realized a Data Visualization to help you to follow the results.
Like most of our Business & Decision LAB projects, it starts in front of our Kanban board during a daily meeting, where we discuss upcoming items of our visualizations.
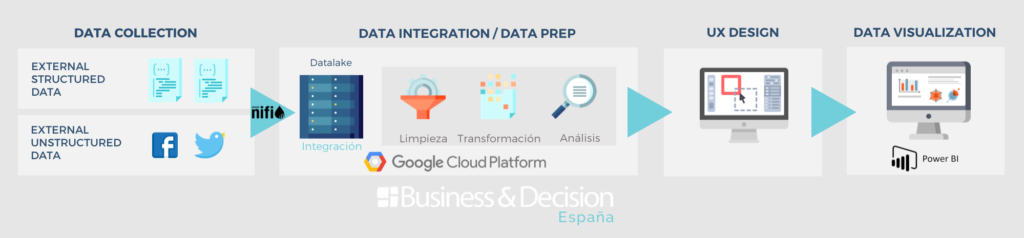
Once the subject is defined, discussed and assigned to one or more members of the team, the work begins. Like all our dataviz projects it follows the same workflow: Data Collection, Data Integration / Data Prep, UX Design, DataViz.
The difficulty of this exercise is to start from a story (of an event in this case) and to find the data that will shore it. In this case, one of the challenges was to give an identity to our Dataviz without using the official FIFA marketing, using creativity of being close but different.
It is an iterative process, we deliver a small content, we test internally. If it works, we keep it, otherwise we rework it until it is satisfactory for the user (which must be kept in mind during all the steps)
In each of our projects we focus a lot of our efforts on methodologies, such as design thinking, UX design, as well as gamification.
It should be known that Data Visualization is inspired by the world of video games. It has been the first to put a layer of design to the dashboards in order to make them tell a story in order to make them easy to understand and enjoy using by users.
A End-to-End process user-oriented
In order to have an end-to-end process user-oriented, we use a lot of design thinking dynamics to follow the iterative cycle of this methodology: Empathy, Definition, Ideation, Prototyping, Test.
At Business & Decision, we want to be as much as possible technologically agnostics because we believe that the essential ingredients for a successful dashboard are:
- data quality,
- technical expertise,
- good history,
- and creativity.
By maximizing the agility of our creative chain, we make sure that we resultst as close as possible to customer expectations while minimizing implementation time and associated costs.


Your email address is only used by Business & Decision, the controller, to process your request and to send any Business & Decision communication related to your request only. Learn more about managing your data and your rights.