
Spark is an open source distributed computing framework that is more efficient than Hadoop, supports three main languages (Scala, Java and Python) and has rapidly carved out a significant niche in Big Data projects thanks to its ability to process high volumes of data in batch and streaming mode.
Its 2.0 version introduced us to a new streaming approach known as Structured Streaming. What is it all about? Well, we invite you to read this series of 3 articles to find out! The first two articles covered data management and processing maintenance, and data transformation and unit testing. In this last article, we will focus on performance testing.
How to test performance?
When we think about “Performance tests”, we think about production clusters.
But do we absolutely need to test everything in a production cluster?
Deploying a Spark programme on a cluster takes time and production constraints are often significant. Hence, the idea is to assess processing performance in the local development environment and to deploy code in the production environment only for validation testing, once the code has already been, to some degree, optimised.
The development environment must help assess (in most cases) our code’s capabilities with respect to our machine’s capabilities.
My Docker development environment
My tests were conducted on our new generation machines: Windows HP G7 (8 logical cores, 16 GB RAM).
Important: make sure that you have a recent Windows version that can run Docker in WSL2.
As you can see, this is a very nice machine,but it is far from being extraordinary nowadays.
To simulate a live environment, we need Spark but also other components:
- Kafka for the data feed
- Spark for indicator calculation
- Postgresql for indicator storage
To monitor my environment, I also added:
- Prometheus to recover the JMX metrics from Java components (Spark, Kafka)
- Grafana to view those metrics in a nice dashboard
All of it, configured in a YAML file in order to generate Docker containers via docker-compose.
Spark
Let‘s take a look at the Spark container’s configuration.
spark-master:
    image: swal4u/spark-master:v2.3.0.3
    hostname: spark-master
    container_name: spark-master
    environment:
      - TZ=Europe/Paris
    command: ["/etc/master.sh", "-d","6G","3"]
    ports:
      - "4040:4040"
      - "8080:8080"
      - "8081:8081"
      - "7072:7072"
    volumes:
      - ./conf/metrics.properties:/usr/local/spark/conf/metrics.properties
      - .:/app
We are using here a cluster with 3 cores and 6 GB of RAM.
We can also see that a file has been modified to upload the JMX metrics.
Here are the main modifications made in metrics.properties.
# Enable JmxSink for all instances by class name
*.sink.jmx.class=org.apache.spark.metrics.sink.JmxSink

# Enable JvmSource for instance master, worker, driver and executor
master.source.jvm.class=org.apache.spark.metrics.source.JvmSource
worker.source.jvm.class=org.apache.spark.metrics.source.JvmSource
driver.source.jvm.class=org.apache.spark.metrics.source.JvmSource
executor.source.jvm.class=org.apache.spark.metrics.source.JvmSource
We also open port 7072 that will be used by Prometheus to recover the metrics.
Kafka
kafka:
    image: confluentinc/cp-kafka:5.5.0
    deploy:
      resources:
        limits:
          cpus: '0.50'
          memory: 512M
    hostname: kafka
    container_name: kafka
    depends_on:
      - zookeeper
    ports:
      - "29092:29092"
      - "7071:7071"
    volumes:
      - ./kafka/prom-jmx-agent-config.yml:/usr/app/prom-jmx-agent-config.yml
      - ./kafka/jmx_prometheus_javaagent-0.6.jar:/usr/app/jmx_prometheus_javaagent.jar
    environment:
      KAFKA_BROKER_ID: 1
      KAFKA_ZOOKEEPER_CONNECT: 'zookeeper:2181'
      KAFKA_LISTENER_SECURITY_PROTOCOL_MAP: PLAINTEXT:PLAINTEXT,PLAINTEXT_HOST:PLAINTEXT
      KAFKA_ADVERTISED_LISTENERS: PLAINTEXT://kafka:9092,PLAINTEXT_HOST://localhost:29092
      KAFKA_OFFSETS_TOPIC_REPLICATION_FACTOR: 1
      KAFKA_GROUP_INITIAL_REBALANCE_DELAY_MS: 0
      KAFKA_OPTS: -javaagent:/usr/app/jmx_prometheus_javaagent.jar=7071:/usr/app/prom-jmx-agent-config.yml
For this case, it is a bit different. We copy a jar and a configuration file via the volume instruction and launch Kafka adding an option with these two elements.
Here, we use port 7071 to transmit the JMX metrics.
To go further on the subject, I refer you to two interesting articles MetricFire – Kafka monitoring using Prometheus and Cloud Walker – Monitoring Kafka with Prometheus.
With which data?
Testing code with data is always tricky!
Streaming complicates the task even further, especially when you want to work on the performance aspect.
For testing to be representative, you must be able to generate close to real, anonymised data in streaming mode. It is not a good idea to use production data as you have no control over the volume of transmitted data.
Data generator setup
Spark includes a “rate” source for its readstream function that helps generate consecutive integers at a certain frequency. With this function, we can easily generate random data and even adjust dates’ generation speed to ensure consistency.
spark
      .readStream
      .format("rate")
      .option("rowsPerSecond", numPerSecond)
      .option("rampUpTime", 10)
      .load()`
      .withColumn("msg", concat(
        lit(test.part(1)),
        lit("request_id"), col("value"),
        lit("node"), col("value") % 8,
        lit(test.part(3)),
        (col("value"))/lit(numPerSecond),
        lit(test.part(5)),
        ...
This piece of code generates fixed sections of our final string through the part method which recovers the beginning, middle and end of our string of characters.
In the middle, we have rewritten some elements as variables using the “value” generated by the rate source and the modulo function (e.g.: %8).
Note that we have used (col(« value »))/lit(numPerSecond) as timestamp.
If we set numPerSecond to 2000, this means that the code will generate 20,000 lines in 10s and that the value of our timestamp will be 20000/2000 i.e. 10s. Meaning that we are simulating data with a consistent timestamp.
Monitoring application
As previously seen, the solution is to collectin Prometheus JMX metrics natively available on most Java components and to monitor them using a Grafana dashboard.
- Metrics configuration is done by means of configuration files.
- Metrics are enabled when processing is launched.
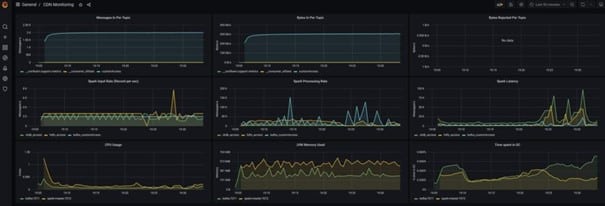
Grafana dashboard for CDN
This is the result you can expect.
If necessary, click on image to enlarge.
Memory management
In Spark, whenever there are performance problems, the quick-fix solution tends to be increasing processing resources.
This is a short-term approach that can be quite costly as you will need to eventually increase your cluster’s resources.
Poor performance can be due to different things:
- batch: bad data distribution on the cluster
- streaming: Kafka + garbage collector
Spark creates by default a data recovery by Kafka partition map task.
- If you only have 2 Kafka partitions, you should use 2 executors.
- If you have a lot of data, you can increase executors’ resources.
- If you have too much data, you must further partition the data on Kafka and adapt the number of executors accordingly.
Garbage collector
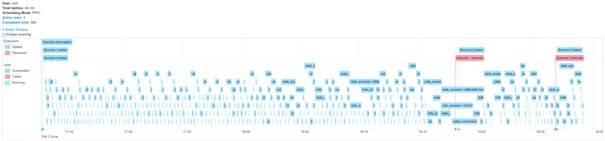
During testing, we detected a specific problem (longer micro-batch times after x minutes). A fair amount of research helped us identify a Garbage Collector issue.
If necessary, click on image to enlarge.
G1GC configuration
G1GC is a new garbage collector optimised for several types of workload. It is not enabled by default on our Java 8 versions. (Garbage Collector by default as from Java 9)
G1GC includes many options to optimise its operation. You must first enable the logs in order to be able to analyse results. Everything happens at the spark-submit level.
--conf "spark.executor.extraJavaOptions=-XX:+UseG1GC -XX:+PrintFlagsFinal -XX:+PrintReferenceGC
-verbose:gc -XX:+PrintGCDetails -XX:+PrintGCTimeStamps -XX:+PrintAdaptiveSizePolicy
-XX:+UnlockDiagnosticVMOptions -XX:+G1SummarizeConcMark" \
CMS Garbage Collector
Another popular garbage collector is the CMS GC (ConcMarkSweepGC).
Unlike the G1GC, it is particularly suitable for stream processing as it cleans memory on the fly.
CMS results were interesting but not as good as G1GC ones (higher latency).
G1GC optimisation
The first approach involved optimising memory use.
--conf "spark.memory.storageFraction=0"         // No need for cache memory
--conf "spark.memory.fraction=0.8"              // 80% of memory reserved for execution
--conf "spark.executor.extraJavaOptions=-XX:InitiatingHeapOccupancyPercent=35 // Trigger GC earlier
-XX:+DisableExplicitGC                          // Good practice
-XX:+UseStringDeduplication                     // Good practice practice
We find here many generic parameters that can be applied to many workloads.
Obtained results
Results after 120 mn
If necessary, click on image to enlarge.
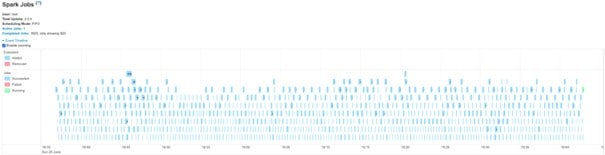
Specs: local cluster 2 cores 6 GB RAM
Data: 8,000 msg/s
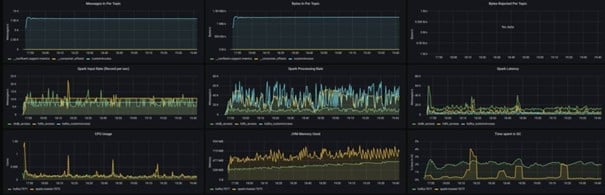
Monitoring after 120 mn
If necessary, click on image to enlarge.
One more thing
Feeling rather confident before launching performance tests on the production cluster, we were really surprised to find out that our processing still had stability issues.
It was all due to Cloudera clusters’ default setting…
Dynamic allocation
A Yarn cluster helps dynamically allocate executors. Which means that the cluster assesses the level of use of executors and can decide to add or remove executors as necessary.
This assessment is based on executors’ idle time and the number of pending tasks.
This mode of operation can cause problems when dealing with stream processing.
It can lead to executors being deleted and then recreated, implying implementation time which can generate latency.
To disable this default Cloudera cluster mode of operation:
--conf "spark.dynamicAllocation.enabled=false"
And now it’s time to close this series of 3 articles on Spark Structured Streaming! I hope they have helped you understand the subject better and I shall see you soon for another post on Big Data.


Your email address is only used by Business & Decision, the controller, to process your request and to send any Business & Decision communication related to your request only. Learn more about managing your data and your rights.