
Data science tools now allow us to expand the scope of what can be done by integrating mapping tools. This is also achievable thanks to the data made freely available by OpenStreetMap and to the efforts of local authorities and enterprises to put their data on line. Open data and data science today enable us to analyse geographical data by measuring interactions that could otherwise only be modelled with great difficulty. Demonstration

OpenStreetMap: bringing together data on diverse topics
OpenStreetMap is an open source collaborative tool that can be freely edited and modified by any user. If you are a business, you can – as on Google Maps – add information on the nature of your business, your opening times and many other fields.
Like Wikipedia, it is an increasingly reliable tool, and has recently benefited from the contribution of Microsoft, which has put the location details of all the American buildings originally developed for Bing Maps onto GitHub.
For data scientists interested in spatial data, OpenStreetMap is an unrivalled source for bringing together data on diverse topics. Data Science software also enables us to consult the data through an API (we’ll come back to this later) and to measure the distance of any point from transport routes or businesses, parks or wetlands.
We will look at a variety of aspects of these tools:
- uses for enterprises
- open data (much public data is geocoded) and APIs
- the interfaces between R / Leaflet and Java mapping libraries such as Leaflet
Three uses for enterprises
1. Counting POIs
Points of interest (POIs) are places such as tourist sites, shops, administration buildings, transport stations, or urban parks.
An enterprise wanting to study its location can use this data as criteria when making its choice and thus optimise its position, for example:
- an enterprise in the retail sector can assess tourism volumes
- an enterprise in the property sector can obtain a better grasp of the advantages of one area over another.
2. The study of shopping areas
In the retail sector, it is important to get to know your potential customers. By cross-referencing socio-demographic or economic data with location, a retailer can better understand both the competition and the population in different geographical areas.
Here, there are two much-used sources of government data:
- The business directory SIRENE
- INSEE census data
3. Optimising logistics
Any logistics service faces the problem of optimising delivery rounds. The opening up of geographical information systems enables all enterprises in the sector to access data and tools that were until quite recently the province of geographers.
The analysis of geolocated data will make it possible to improve the allocation of delivery vehicles to warehouses thanks to the use of operational research algorithms.
Combined with the internet of things (IoT), these same companies can also follow their fleet of vehicles in real time, calculate the associated distances and transport times and tell customers when to expect their deliveries.
Open data and API
More and more enterprises and public bodies are providing the information they hold as open data. This data is accessible:
- On a dedicated web platform
- Through an API used to make requests from most of the data tools on the market
What is an API?
API is the abbreviation for “application programming interface”. In Google, the best-known APIs are Google Maps in the field of cartography or Adwords, which enable advertisers to interact through their own applications with their Adwords account.
There are also more and more artificial intelligence APIs. These are either freely useable and documented on the web, or created by a data scientist for a particular business use. A simple example of this second case would be the creation of a machine learning model with Microsoft Azure ML and calling this model for use with new data in Excel. REST APIs have spread rapidly, because they are simply defined by standardised methods.
Roughly speaking, these methods could be compared with a TV remote control, where every button has a function (change the channel, increase the volume, etc.). Taken together, these buttons form the interface through which the user and the television set communicate.
Open data API: example
To illustrate an open data API, we will use the MEL platform. The documentation page of this API explains very clearly what it can do.
It distinguishes:
- A dataset service that can be used to search the multiple datasets available
- A record service that can be used to search all the information in a dataset
Mass data can also be exported in several formats (csv, xls, xml, json, etc.). This interface is the simplest if you are nervous about getting started with an API. It is another part of the API known as download.
If the data is spatial in nature, a mapping service is included in the platform.
Spatial data
Information about public transport is among the data categories available on the MEL platform. Each dataset is geocoded. We’ll now see a simple example of how to use them with a statistical programming language. For mapping we will use Leaflet under R or Folium under Python.
We will use:
- a list of bus, metro and tram stops in geojson format (in the form of points – latitude + longitude, with descriptive data)
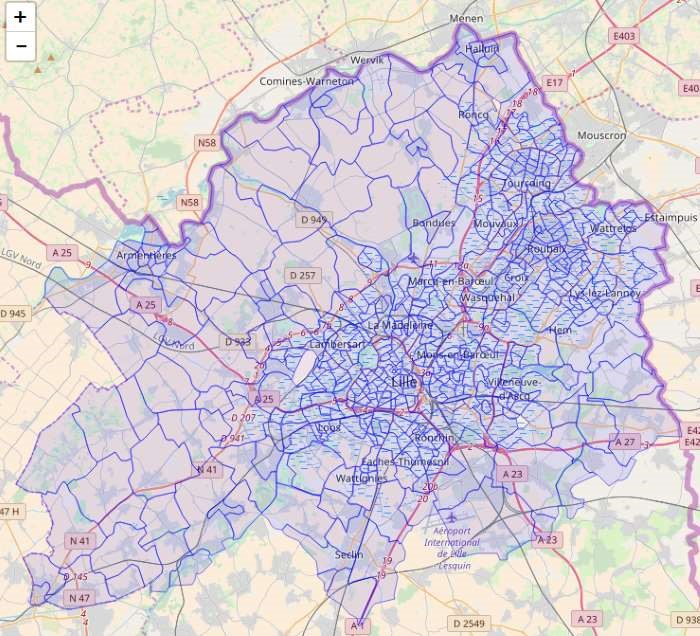
- The limits of IRIS zones , which are INSEE census areas with a population of around 2000 to 3000 persons in shapefile format (in the form of polygons + descriptive data)
These data can be readily imported for use as spatial objects (SpatialPointsDataFrame / SpatialPolygonDataFrame under R, or GeoDataFrame under Python).
We can already create, for example, a simple map of the Lille – Roubaix and Lille – Tourcoing tram network.
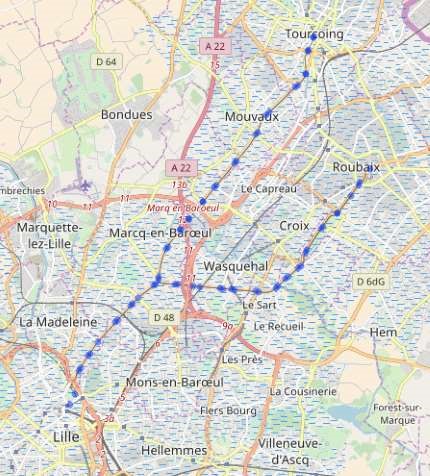
As well as the limits of IRIS zones:
Spatial data and tabular data
We are trying to measure public transport density in local authority areas in the Lille agglomeration. This can be used as a location criterion for a retail business or a future real estate owner.
For simplicity’s sake, we can calculate, for each IRIS zone:
- the centre (or centroid)
- the number of bus / metro / trams in a radius of 500 and 1000m (we call these “buffers”)
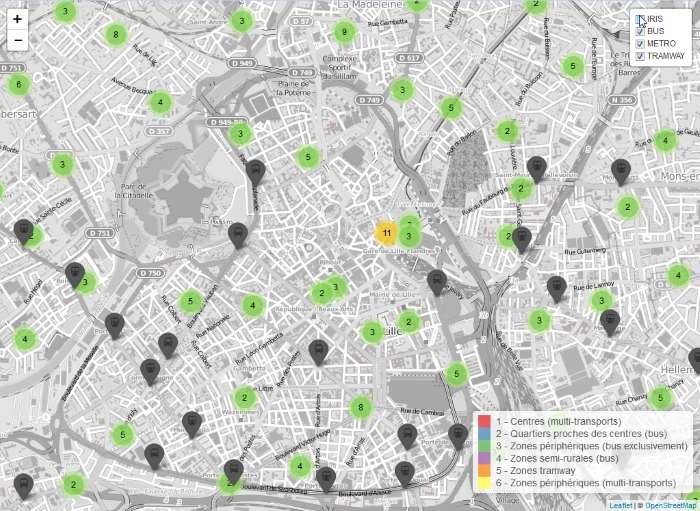
This produces a table with six indicators for each zone, and we apply a clustering algorithm (kmeans for example) to segment the various zone types.
The data can be attached by area (population, etc.) to carry out these these calculations. Finally, every type of data can be represented with colour scales, appropriate captions, and several layers of information in a single interactive map.
The result is as follows:
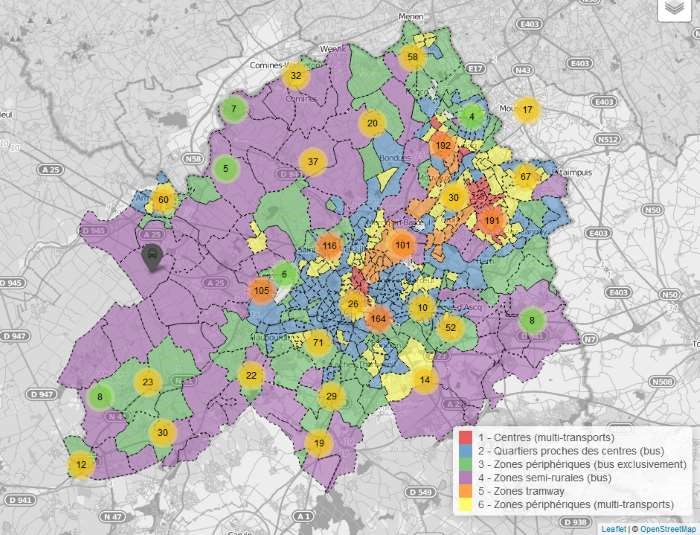
We can navigate interactively in the map (click on the image) to display the stations. Note that a click on a zone or a station icon brings up its name in a bubble:
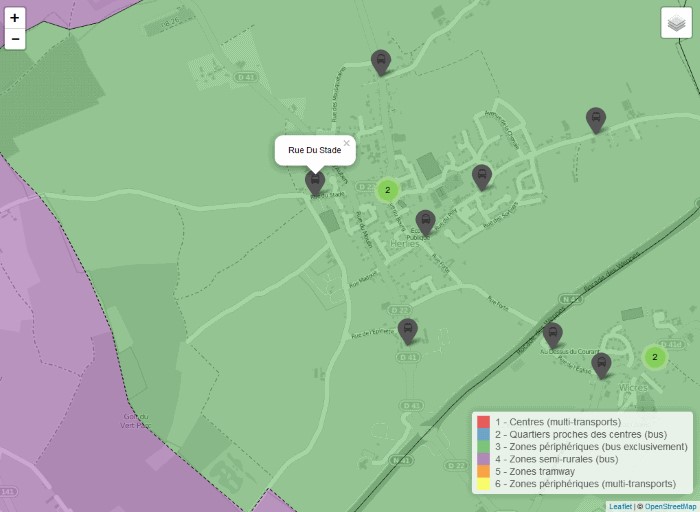
It is also possible to select whether to display different layers of the map from the menu at top right.
A few lines of code thus create a tool that can be used on line just as it is, or integrated into a tool with more varied content, such as a dashboard.
Data science with spatial data
Once the data has been assembled and represented, data scientists can use multiple techniques and resolve questions of:
- supply and demand (where is the demand not met?)
- spatial autocorrelation (are two geographically close entities evolving in the same way?)
- data interpolation (estimation of data step by step, linked to autocorrelation)
- spatial classifications
- network analyses (roads, etc.)
This opens up an entire new playing field for many enterprises.


Your email address is only used by Business & Decision, the controller, to process your request and to send any Business & Decision communication related to your request only. Learn more about managing your data and your rights.