To exploit the full potential of Big Data projects, proper data documentation is essential. DataOps principles help set up an adequate approach – a prerequisite for the success of all ensuing projects and adding value to all the company’s data.

Specific characteristics of Big Data projects
A modern Big Data architecture should help:
- generate output based on a broad spectrum of data (Business Intelligence 3.0)
- perform advanced analytics, implementing statistical, machine learning, and Artificial Intelligence algorithms (Data Science)
- build data-centric operational applications such as a 360-degree company view or a recommendation engine for a commercial website
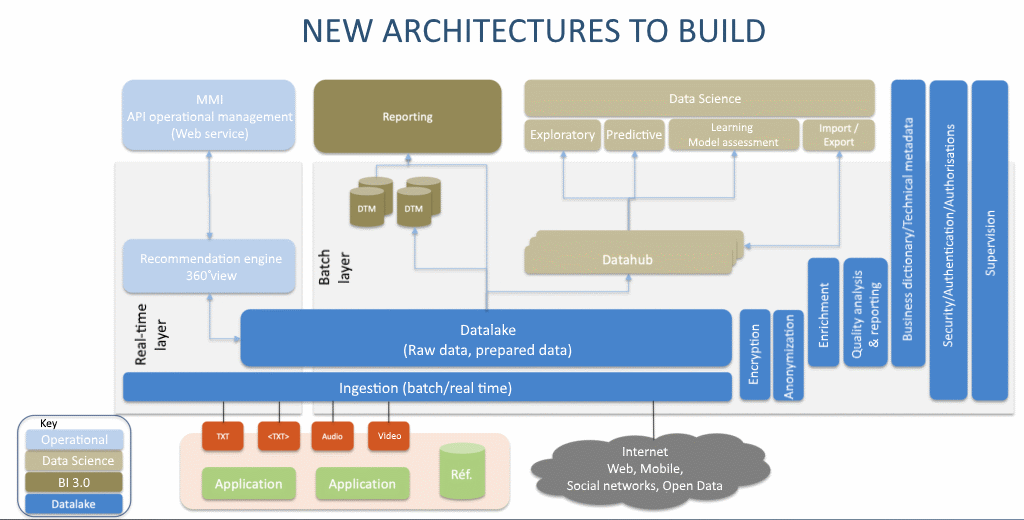
Objectives that it achieves by centralizing all business data within a Data Lake designed to serve all of the various purposes (data-centric architecture). Given business departments’ enthusiasm for this new tool, the Data Lake can rapidly mushroom: in fact, we know a company that hosts no less than 400 databases and almost 70,000 tablets within its Data Lake.
So, how to find your way around this Data Lake?
First, by using comprehensive documentation that maps existing data:
- name
- description
- management rule
- source data needed for data calculation
- personal data for the GDPR
- etc.
Experience shows that such documentation should be prepared during the Big Data project building phase, or it may never be finalised.
Then, solutions available on the market that can support you through your DataOps initiative should be investigated.
Data mapping solutions
Modelling tools
With modelling tools such as PowerDesigner, data can be mapped to a certain extent using a description field. However, they cannot help document data in a comprehensive manner. They are highly technical tools that do not allow the sharing of documentation with business functions.
Their main appeal lies in the fact that they can be used to generate a visual model representing the functional links between our tables. We have found nothing better to make advanced users understand models.
This solution’s number two asset is, a priori, its ability to generate models with data description directly into the target system. But its support of Hive and noSql bases remains limited.
Nowadays, companies are using these DataViz solutions less and less or are abandoning them in favour of more limited, but free solutions such as Valentina Studio.
Agile tools
Big Data projects are often carried out using an agile method. With the Confluence solution, you can thus easily describe user stories, but is it a good solution to document a data project? No, definitely not. Two major obstacles come to mind:
the solution is usage-centric (vertical approach for a group of users) and not suitable for table description (cross-functional approach since one same table can have several uses).
its web interface hinders mass data entry on Big Data projects (we recently completed a project that included almost 5,000 different data).
Mapping tools
The solution seems simple enough. To map a project’s data, nothing better than a mapping tool! 🙂
The tool currently gaining in popularity is Data Galaxy.
Data Galaxy is a web solution. Though subject to the same data entry restriction, it provides an assistant to help import massive data from .csv files (manually generated from a modelling tool for example).
The solution’s strong point is without a doubt the sharing of documentation with users. You can perform data searches, carry out impact assessments or collaborate with other users to indicate to an administrator that an inaccurate description, for example, must be corrected.
Data Galaxy is an excellent option to share data documentation once the project is completed. On the other hand, the assistance it provides during the course of the project is limited due to its data entry constraints.
Presentation of iSpecs
Faced with the fact that all database solutions were falling short of satisfaction, we came up with the idea of developing our own in order to optimise the DataOps process.
In contrast to other solutions, iSpecs (for industrialisation of Specifications) was designed to help specify large-scale Data projects. The tool’s main feature is overall specification consistency monitoring. But as you will discover, it can do so much more.
An Excel template to facilitate data entry
As observed previously with respect to market solutions, web interfaces are not really suitable for mass data entry. We thus opted for a good old Excel file available in all companies. We believe that Excel presents numerous advantages:
- everybody knows how to use it
- powerful copy/paste feature
- option to extend a column by duplicating a cell’s value
- pane to facilitate viewing
- etc. (a lecture on the subject would be pointless)
To remain as open as possible, we chose not to include any macros.
We merely developed a very simple Excel template with a few tabs having only basic Excel features:
- cell protection to avoid accidental modifications
- list of choices for some columns
There is one workbook per table. This facilitates collaborative work by allowing several people to work simultaneously on different files.
Each workbook contains several tabs. The first two tabs are used to specify the table, the others help describe a test case. A test case contains input data sets required to populate our table and the expected result. The test case helps ensure through examples that data formats are not ambiguous. Moreover, from an operational point of view, they can be used to test the processing chain that we are currently developing.
This is what the template in question looks like:
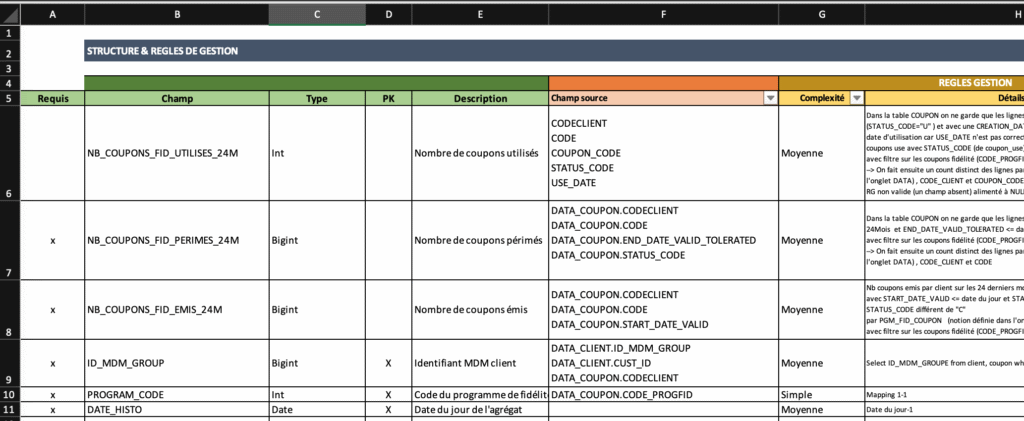
Please note that some cells can have multiple rows.
An application to analyse and control specifications
What to do with all of these data files now? We developed a web application in python. For data storage, we use MongoDB.
The application is extremely easy to use. You drop the specifications files in a directory, launch the application and click on “Load data,” and you are done!
The integration phase gives us the opportunity to format data and thus standardise the subsequent display. Multirow cells are managed as tables.
This is what the application looks like once the data is loaded:
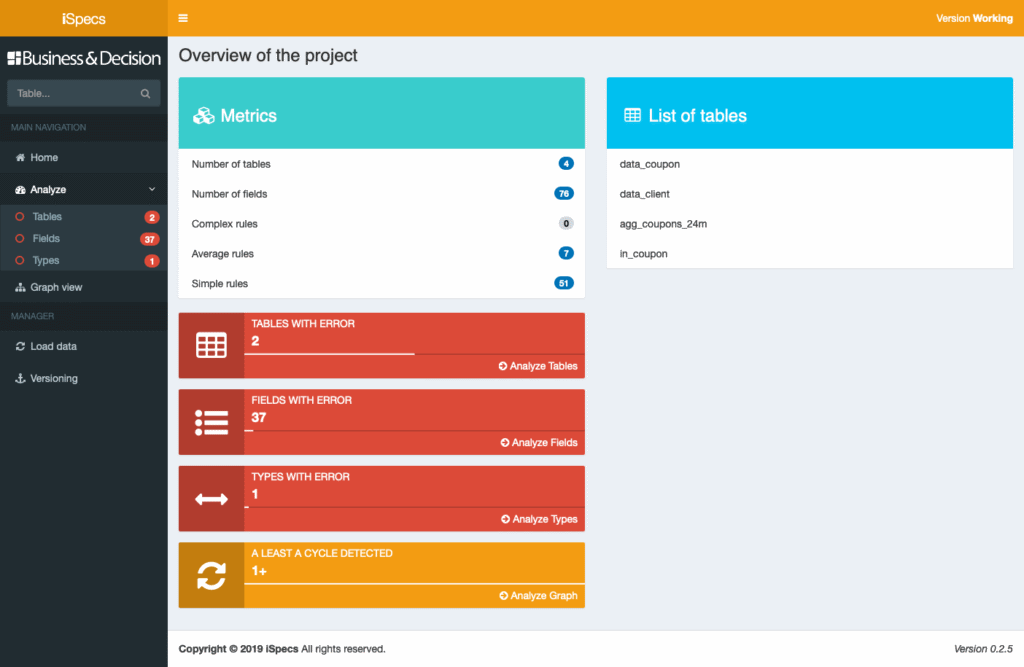
The application presents the project’s metrics (number of tables, number of fields, number of rules per complexity).
All project errors are also directly visible. In this example, there are 2 tables with errors which means that some field values are calculated using data from two tables that do not exist.
By clicking on the link, you can directly display the missing tables and the fields that cannot be populated.
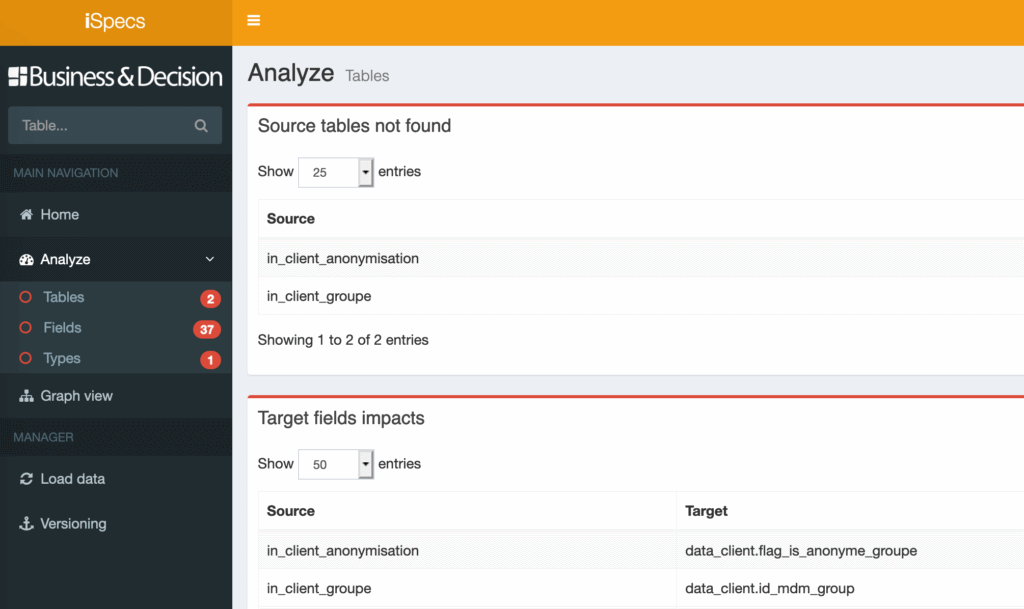
All that needs to be done now is to correct the errors in the source file(s). Once this is done, the data is reloaded to ensure that all errors have been eliminated.
A similar check is carried out directly at field level. Finally, for fields that have not been altered (1-1 mapping), we must ensure that the type has not changed from input to output.
Specifications can be versioned in a very simple way. The most important thing being that you can work in agile mode on several versions simultaneously.
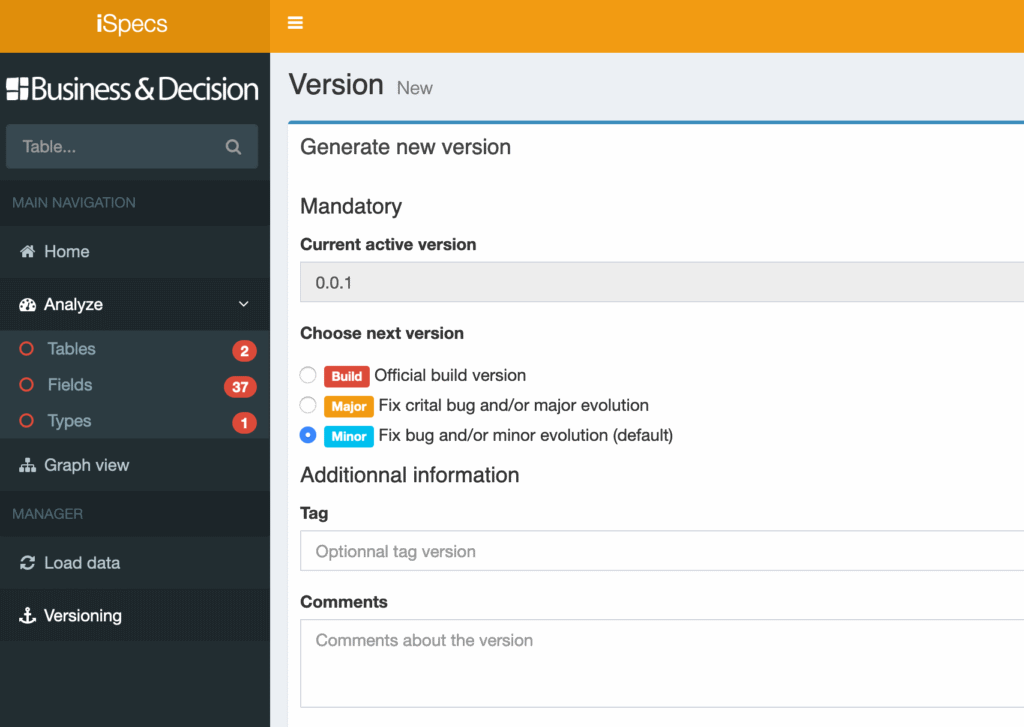
Automatic documentation generation
The web application helps navigate through tables and view data. A search module facilitates direct access to information.
The application also generates a complete data dictionary in Excel format to facilitate sharing with a great number of users without having to worry about licence issues.
For a more advanced solution, it is worth considering pairing up iSpecs with Data Galaxy or Confluence to take advantage of database document sharing and collaboration opportunities.
And so much more…
The iSpecs application does not only generate a dictionary for users.
It also generates table creation commands (ddl) in order to automate the creation of Hive tables (these ddls are also used by our iTests solution to automate tests with Spark).
The application also generates ddls in Valentina Studio format to be able to produce a graphic view of the data model.
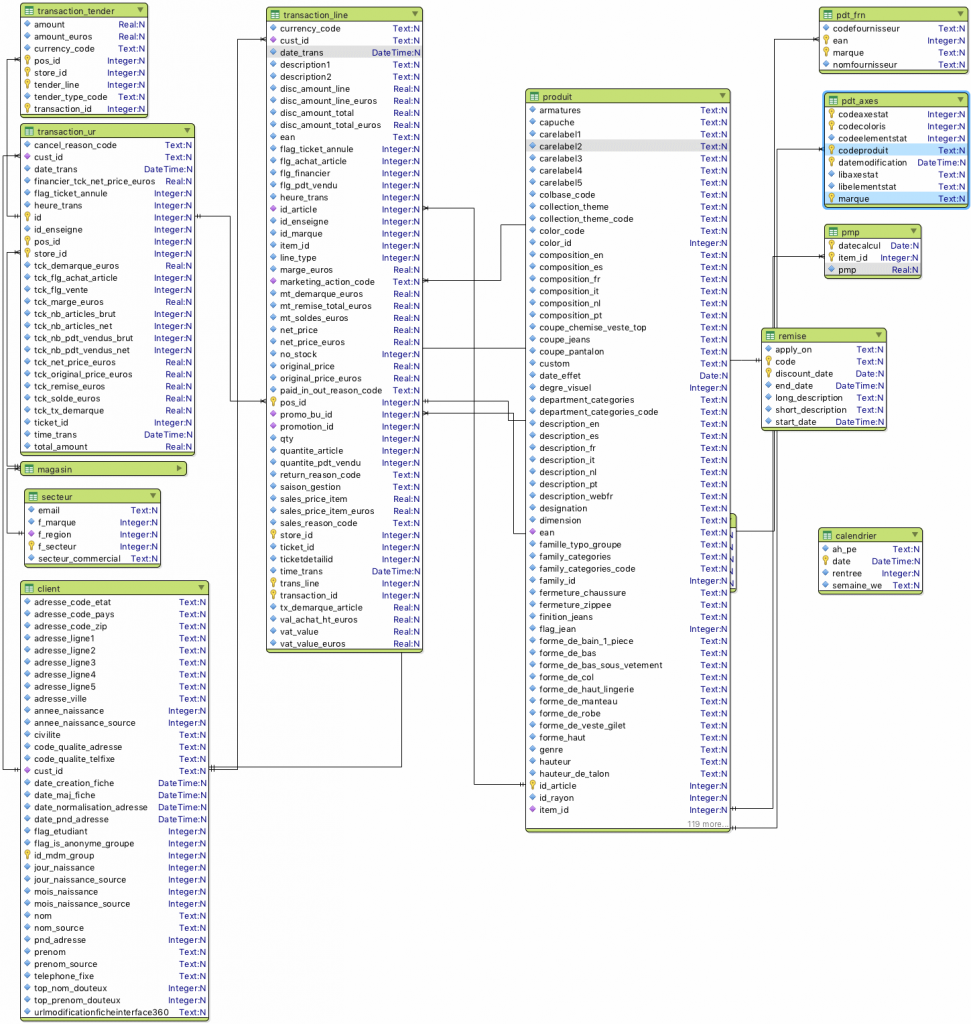
Finally, the iSpecs application can analyse impacts by determining the data feed links between tables. The primary aim of this module is to detect any loops within graphs, which would be a design flaw (this can happen in complex projects having numerous tables and detecting such problems is not such an easy thing to do).
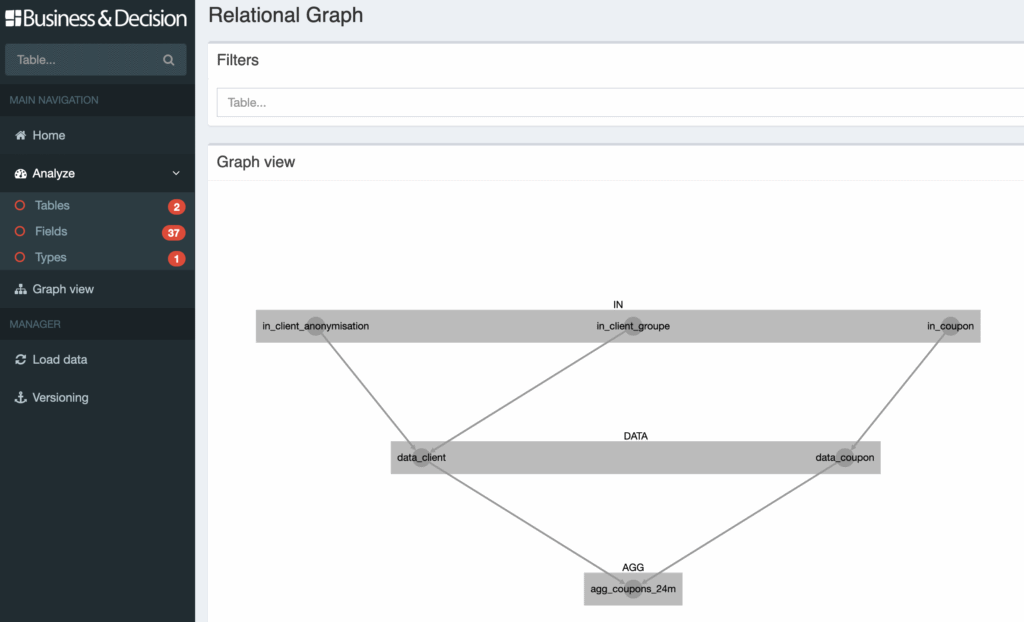
We are still working on this module. Other than impact analysis, we should soon be able to generate a comprehensive processing sequencing plan, based only on specifications.
A path to continuous integration
As you can see, iSpecs is not just about documentation generation. It is a real tool that will help you build your Big Data project.
It was designed to increase global specification consistency. Since it automates numerous operations, it can be used in an agile context at no extra specification development cost.
Paired up with our iTests application and DataOps, it is a great first step to take into the continuous integration world.
This tool is used in all of Business & Decision‘s Big Data projects.
Please contact us to know more or to obtain documentation.




Your email address is only used by Business & Decision, the controller, to process your request and to send any Business & Decision communication related to your request only. Learn more about managing your data and your rights.